

Natural Climate Change Brings Both Drought and Floods.


I love busting myths and the myth that I wish to bust today is the claim that anthropogenic climate change (ACC) brings floods in some areas and droughts in others.
The problem with this claim is that is it assumes climate change is the same thing as ACC.
Usually, the burden of proof is the duty of the claimant, but in this case none is offered, other than the existence of floods and droughts.
The equivalent practice would be to argue that the widespread use of natural gas in central heating during the winter season was responsible for the arrival of spring and then to declare yourself victorious when the snow melted in the spring.
Ok, maybe I am being a little too facetious too early, but I am confident you will see by the time this descriptive prose is read, that ACC enthusiasts have similarly laid arbitrarily claim to natural processes as evidence of their preferred hypothesis with insufficient merit to hold any water.
Whenever I approach trouble shooting exercises like this, I return to the fundamentals of atmospheric physics, by first looking to the dynamic response of the environment to the Seasonal Cycle.
It is from this vantage point that we will find the most likely explanation for how natural climatic changes can give rise to droughts in some regions and to floods in others.
The reason I start with the Seasonal Cycle, is we know from first principles that the Earth's Hydrological Cycle is controlled on a first order basis by orbital dynamics, as too is the cyclical pattern of summer transitioning to winter in either hemisphere.
Due in part to the tilt of the Earth, the tropical latitudes receives the most solar radiation on average over the entire Seasonal Cycle and thus on average is in a state of energy surplus, while for much the same reasons the polar latitudes exist in an average state of energy deficiency.
This annual average energy gradient between the tropics and polar atmospheres gives rise to the heat pump that drives global circulation patterns.

Due to this geographical energy distribution, the equatorial tropics are where we see the highest rates of precipitation relative to the rates of evaporation. This peculiar feature is shown in Figure 2 as a difference map for evaporation minus precipitation. Note that the tropics are deeply negative, while the subtropical latitudes are conversely positive.

To better understand the mechanics behind the excess state of precipitation that exists along the narrow equatorial zone, one simply has to examine a cross section of the atmosphere centered at the equator and visualize the convective response of the lower troposphere in either hemisphere.
Figure 3 is absolutely fundamental in understanding the underlying geographical extremes in evaporation versus precipitation that exist tightly centered around the equatorial latitude(s). As shown, due to the maximum state of solar radiation that exists along the equatorial zone, air masses in this region pull in lower tropospheric air masses from either hemisphere as deep convection occurs within this narrow zone.
As this deeply convecting air mass and cumulonimbus clouds rise as high as 20 km, it cools, precipitates (dehydrates) and gradually looses buoyancy, before diverging into either hemisphere along the tropopause.
Notice how both dehydrated diverging air masses eventually fall under gravity along their respective subtropical latitudes?

In atmospheric physics we call the zone of converging air masses the Intertropical Convergence Zone (ITCZ) and the zones where dehydrated air masses subside back down into the lower troposphere, the Horse Latitudes.
Note that the Horse Latitudes are where we find higher evaporation minus precipitation and thus are where the great global deserts reside (e.g., Sahara, Gobi).
The Horse Latitudes are droughty by nature, because subsiding dehydrated air masses compress and heat as they fall under gravity, thereby creating a high pressure / temperature inversion lid over regions (Heat Domes) where they fall. These subsiding air masses are also called anti-cyclonic high pressure systems and are typically dominated by clear skies, with above average sunshine intensity.
This collective process is fundamentally why evaporation exceeds precipitation along either side of the equatorial zone or ITCZ.
Conversely, the absence of this inversion lid within the ITCZ gives rise to deep convection and the precipitation of lower tropospheric water vapor transported from both subtropical zones into the equatorial Firebox.
This gives rise to meridional (north-south) transport of moist air from high to low pressures systems in both subtropical zones, and is ultimately why the ITCZ's precipitation rate exceeds its evaporation rate.
By convention, the ITCZ is called the zone of maximum precipitation and the two counter rotating air masses along either side are called the Hadley Cells.
The Hadley Cells are geographically defined by extreme rainfall along their lower latitude limits and by extreme drought along their higher latitude limits.
Now that we have these basic mechanics worked out, it is time to throw in a curve ball to see how orbital mechanics shifts the monthly average position of both the ITCZ and the Horse Latitudes as a function of the Seasonal Cycle.
Figure 4 shows the annual migration of the Hadley Cell Convergence Zone (or ITCZ); note that its annual path is to always move towards whichever hemisphere is experiencing summer.
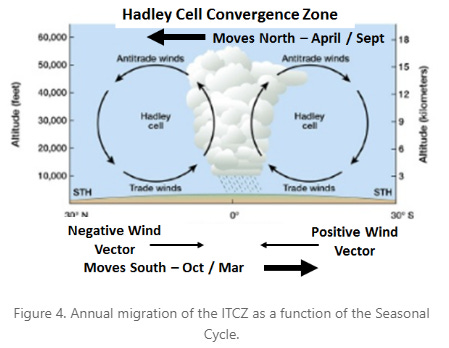
This fundamental process is at work behind the Indian Summer Monsoon and why its dry season coincides with winter.
During the summer, the ITCZ migrates to higher sub-tropical latitudes in the Northern Hemisphere, while conversely during the winter, the ITCZ migrates towards the higher latitudes of the Southern Hemisphere.
Note that fundamentally, this orbital forcing gives rise to a cyclical pattern that manifests itself on an annual basis set by the frequency of the Earth's rotation around the Sun.
I propose that we view this as the first order driver behind the migration of the ITCZ into and out of either hemisphere on an annual basis.
This is important, for when we begin to examine inter-annual to millennial migration patterns of the ITCZ, we find evidence that orbital mechanics continue to dominate long term modes of change in the latitudes of maximum (ITCZ) and minimum precipitation (Horse Latitudes).
The best known case in point is the evolution of the North African Sahara region over the Holocene Interglacial period, as shown in Figure 5.
It is well known in paleoclimatology that one of the most defining characteristic of the evolution from the last glacial maximum to the Holocene Thermal Maximum was the net displacement AND intensification of the ITCZ (precipitation) northward over the Sahara region.
Likewise, it is known that the subsequent re-desertification of North Africa coincides with the slow reversal of this orbital (Milankovitch) forcing and the gradual migration of the average position of the ITCZ back towards the Southern Hemisphere.
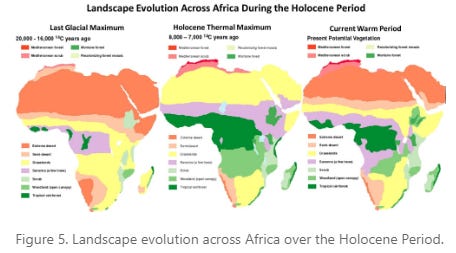
Again, the ITCZ moves towards whichever hemisphere is warmer.
This hemispheric thermal gradient dependence in the migration of the ITCZ and Horse Latitudes are why we often see paleo-representations of this long term pattern of change as shown in Figure 6.
While I will not delve into the geochemical analysis that went into creating this 12,000 year record of the global migration pattern of the ITCZ, I will simply say that changes in precipitation give rise to many different geochemical changes in the near surface layer that can be calibrated as a proxy for precipitation.
Additionally, by examining how these geochemical markers change with depth from the surface, one can in effect, peel back the layers of time and produce a record for how precipitation has changed over geological time scales.
The red, black and blue data points coincide with distinct sampling points across the global tropical latitudes and are quite often, shallow caves that are susceptible to gradual changes in ground water seepage, but are not directly exposed to precipitation.
Take note in this representation, how the Indian Summer Monsoon strengthens as the hemispheric temperature gradient from the north to the south increases. More specifically, it shows that precipitation in the Northern Hemisphere increases as it warms faster than the Southern Hemisphere.
Conversely, as indicated by the red data points, as the ITCZ moves northwards, the Southern Hemisphere becomes drier. This is due to the net displacement or migration of the ITCZ away from the Southern Hemisphere.

Note that Figure 6 shows both low and high frequency modes of change.
This same author examines and reports on the higher frequency modes of change by showing the same representation over data points specific to the 20th century and focuses specifically on the ITCZ migration pattern over the Sahel region of North Africa.
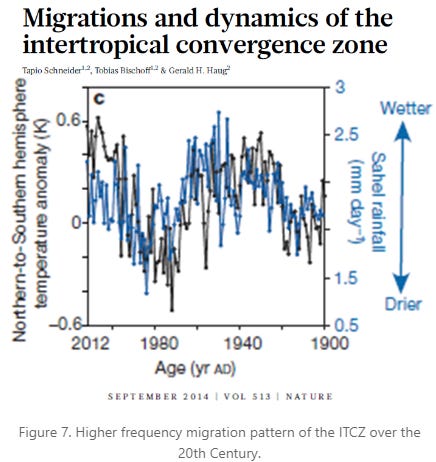
Note the multi-decadal change in precipitation across the Sahel region and the difference in hemispheric air temperatures, are both found to change according to a cyclical pattern with a 60ish year peak to peak period.
Many will recall that the severe droughts within the Sahel region in the late 1970s to early 1990s, abruptly ended. The reason being, was the average position of the ITCZ moved northward - again - just as it had during the 1930s to 1950s.
Of course, as the ITCZ migrated northward towards the Sahara after the 1980s, so too did the corresponding northern Horse Latitudes.
Figure 8 shows the multi-decadal changes in cloudiness and sunshine hours over Europe as the Horse Latitude moved northward with ITCZ during this latter part of the 20th century to present.
Remember, anticyclonic high pressure systems, created by subsiding dehydrated air masses over the Horse Latitudes, creates lower cloud cover and higher sunshine hour meteorological conditions.

When we look at longer term sunshine hours or surface solar radiation (SSR) records for Europe, we find that it shows the same 60 year multi-decadal pattern exhibited by the ITCZ over North Africa during the 20th century.
Europe, particularly Southern and Central Europe, have witnessed an increase in drought frequency over the past couple of decades.
The reduction in cloud cover and prolonged sunshine, driven by persistent anticyclonic systems and amplified by climate change, have increased evapotranspiration and soil moisture deficits, contributing to more frequent and severe droughts. This is most evident in events like the 2018 and 2022 droughts, which align with record-low cloud cover and high sunshine hours.

In closing, while the mechanism associated with the migration patterns of the Hadley Cells, operating on both an annual (Seasonal Cycle) and millennial (Milankovitch) basis, is widely excepted to be due to Orbital Dynamics, the origin of the forcing associated with the 60 year cycle is widely debated.
You can soon expect a dedicated article on the 60 year cycle, where I will argue that the forcing may very well be the shifting solar system center of mass or barycenter.
The hypothesis presented will be that the 60 year cycle is caused by shifting gravitational tidal forces of the Gas Giants, acting on the Sun’s magnetosphere, which acts as a massive geomagnetic shield against ionizing radiation from deep space.
Ultimately, I argue that claiming ACC is responsible for longer term changes in drought and intense rainfall, is akin to claiming that burning natural gas to keep warm in the winter season, is responsible for the arrival of spring and that the arrival of spring is proof of the hypothesis.
This is the best article I have seen on the effect of orbit and rotation on climate. Looking forward to more.
Dr. Roy Spencer talks about deep ocean cycles among other things, are these mutually exclusive theories or compounding complicating phenomenon?
I’m sure you are right but it’s too complicated for this bear’s brain. If we are to drive a dagger through the Net Zero heart, it needs to explain how the 0.04% of the Earth’s atmosphere that is CO2 could not cause the Climate changes claimed, especially as 97% is naturally produced.
$Trillions are being fleeced from millions of people based on this ridiculous, false premise.
We are winning, but we need to kill the lie .